在数据集列表中在每行数据的末尾有
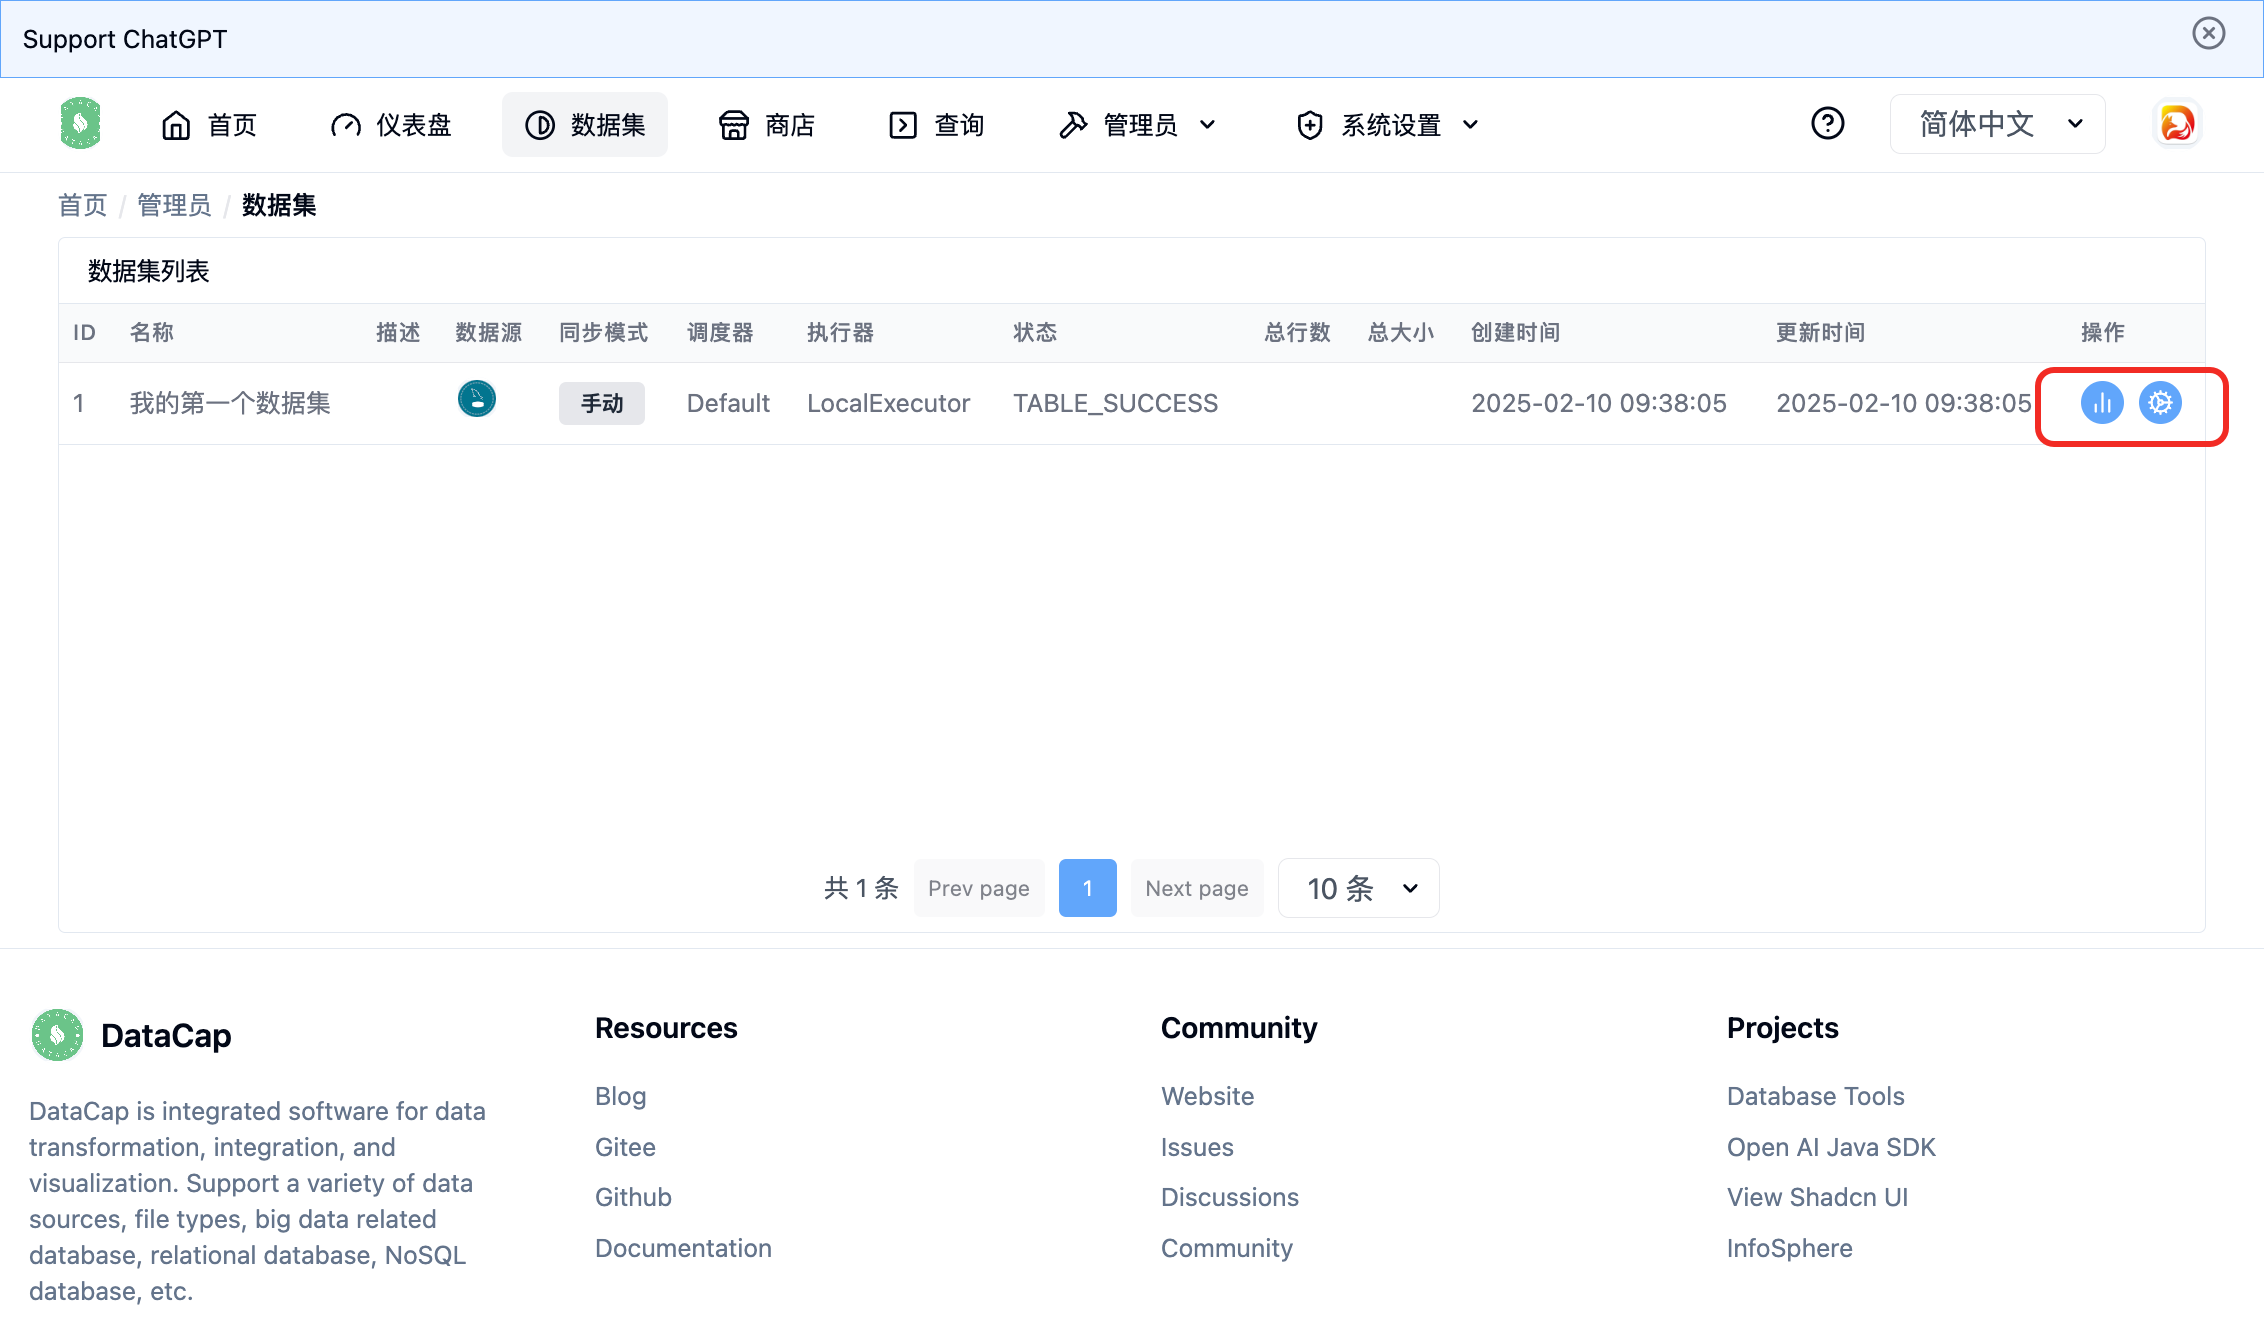 我们点击 :ChartNoAxesColumn: 图标后会跳转到
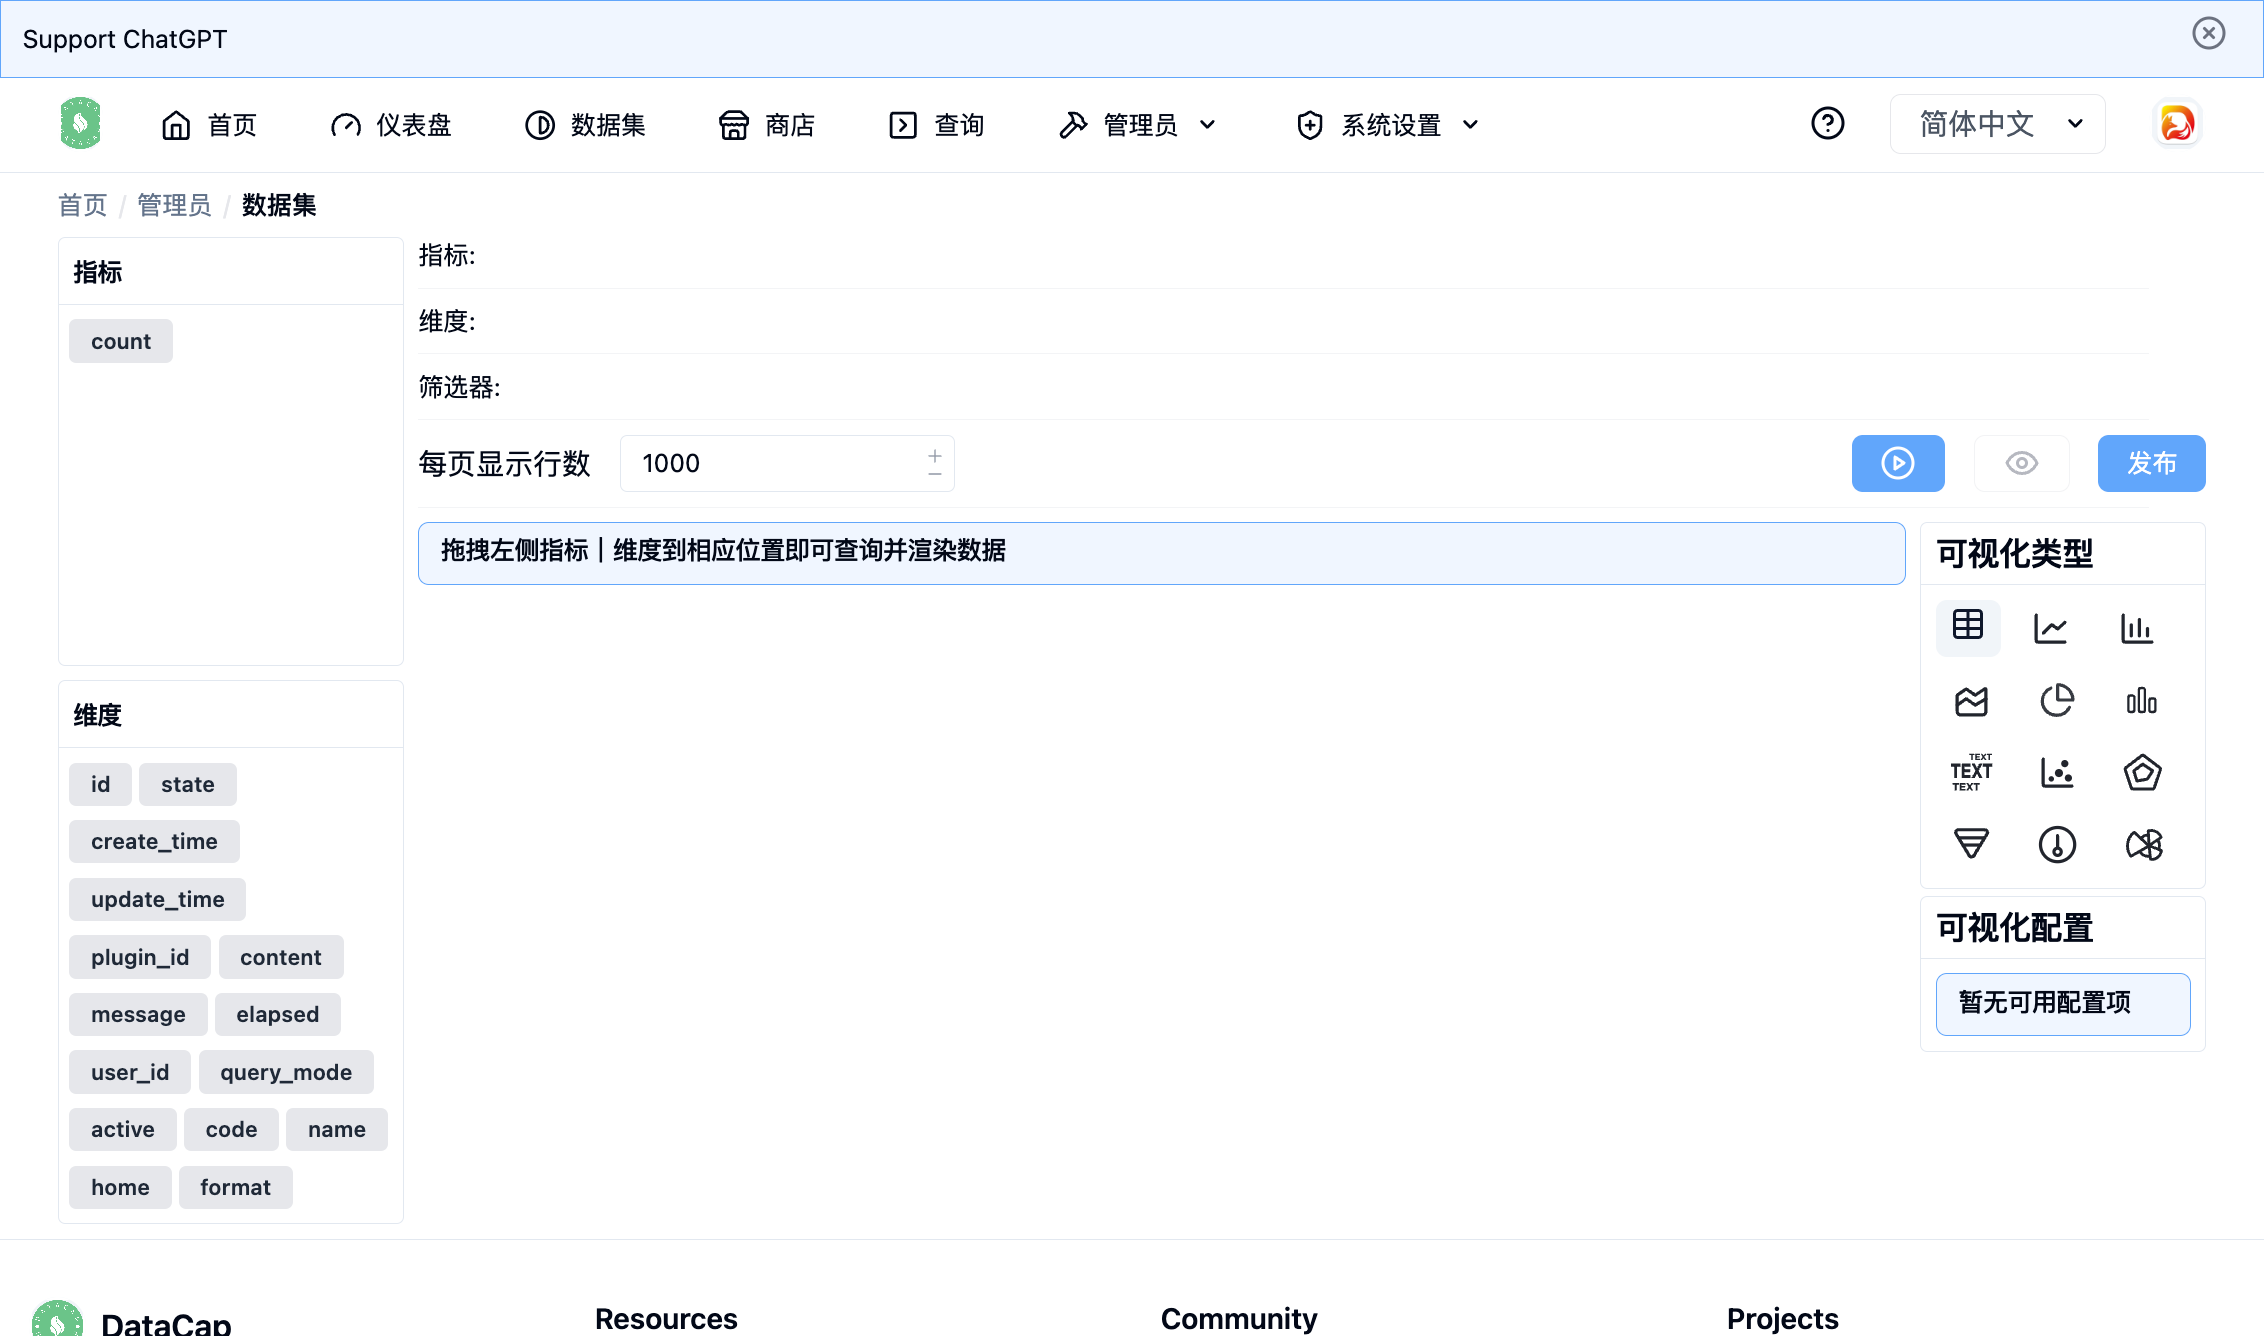 页面分为左右两侧,左侧是当前数据集的
 可以配置当前指标的
 可以配置当前维度的
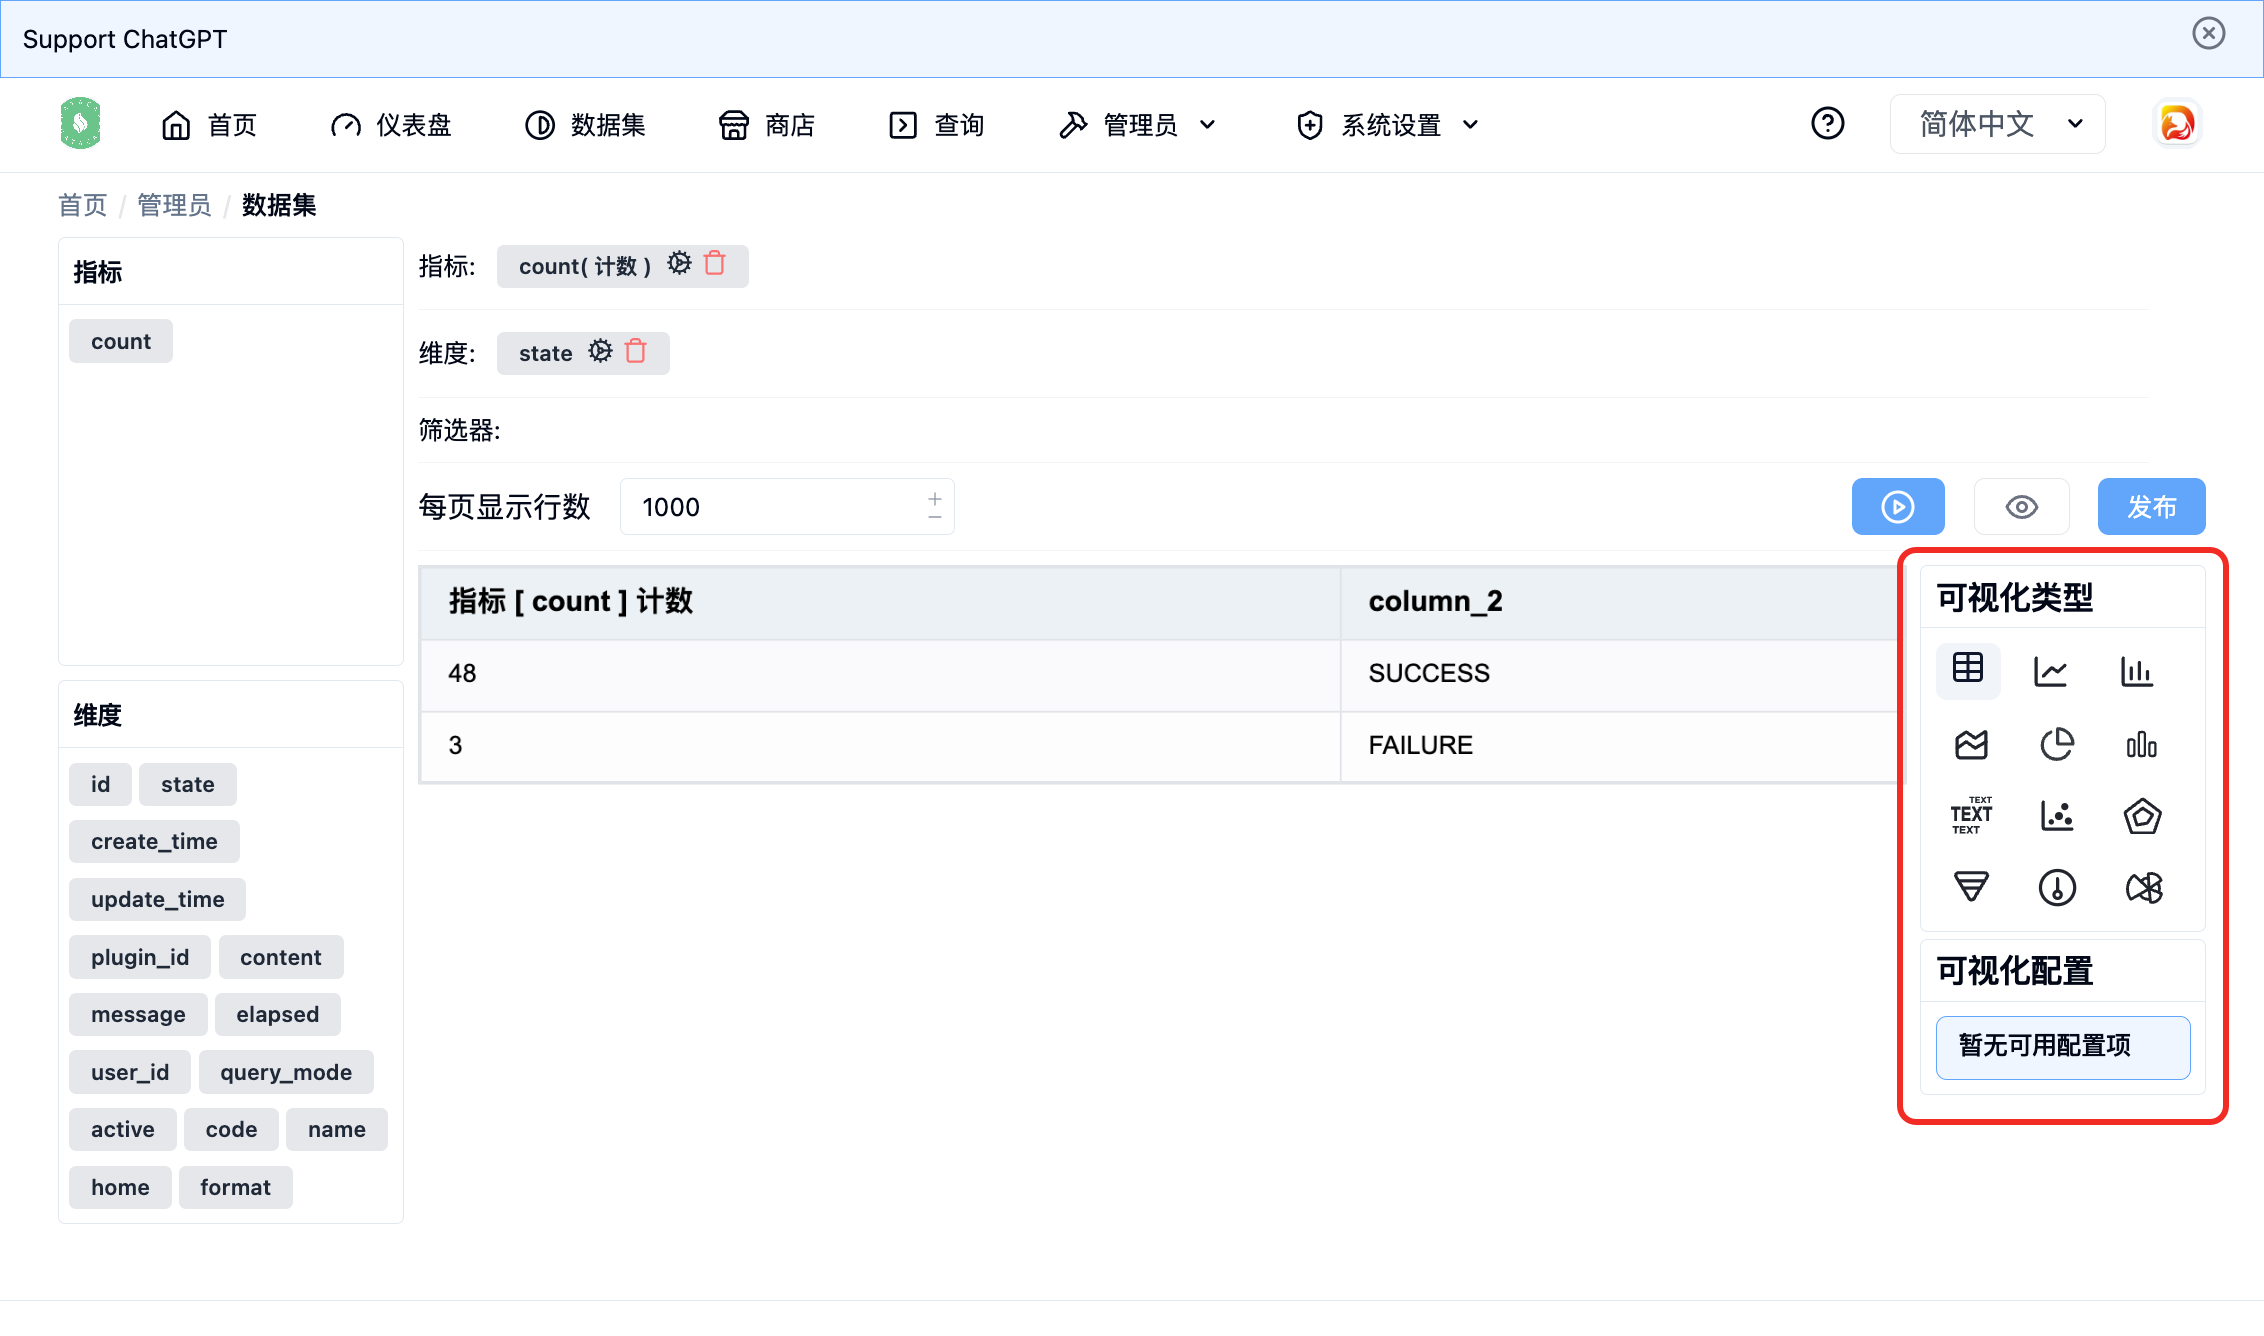 可以根据自己的需求定制目前已经支持的图表。
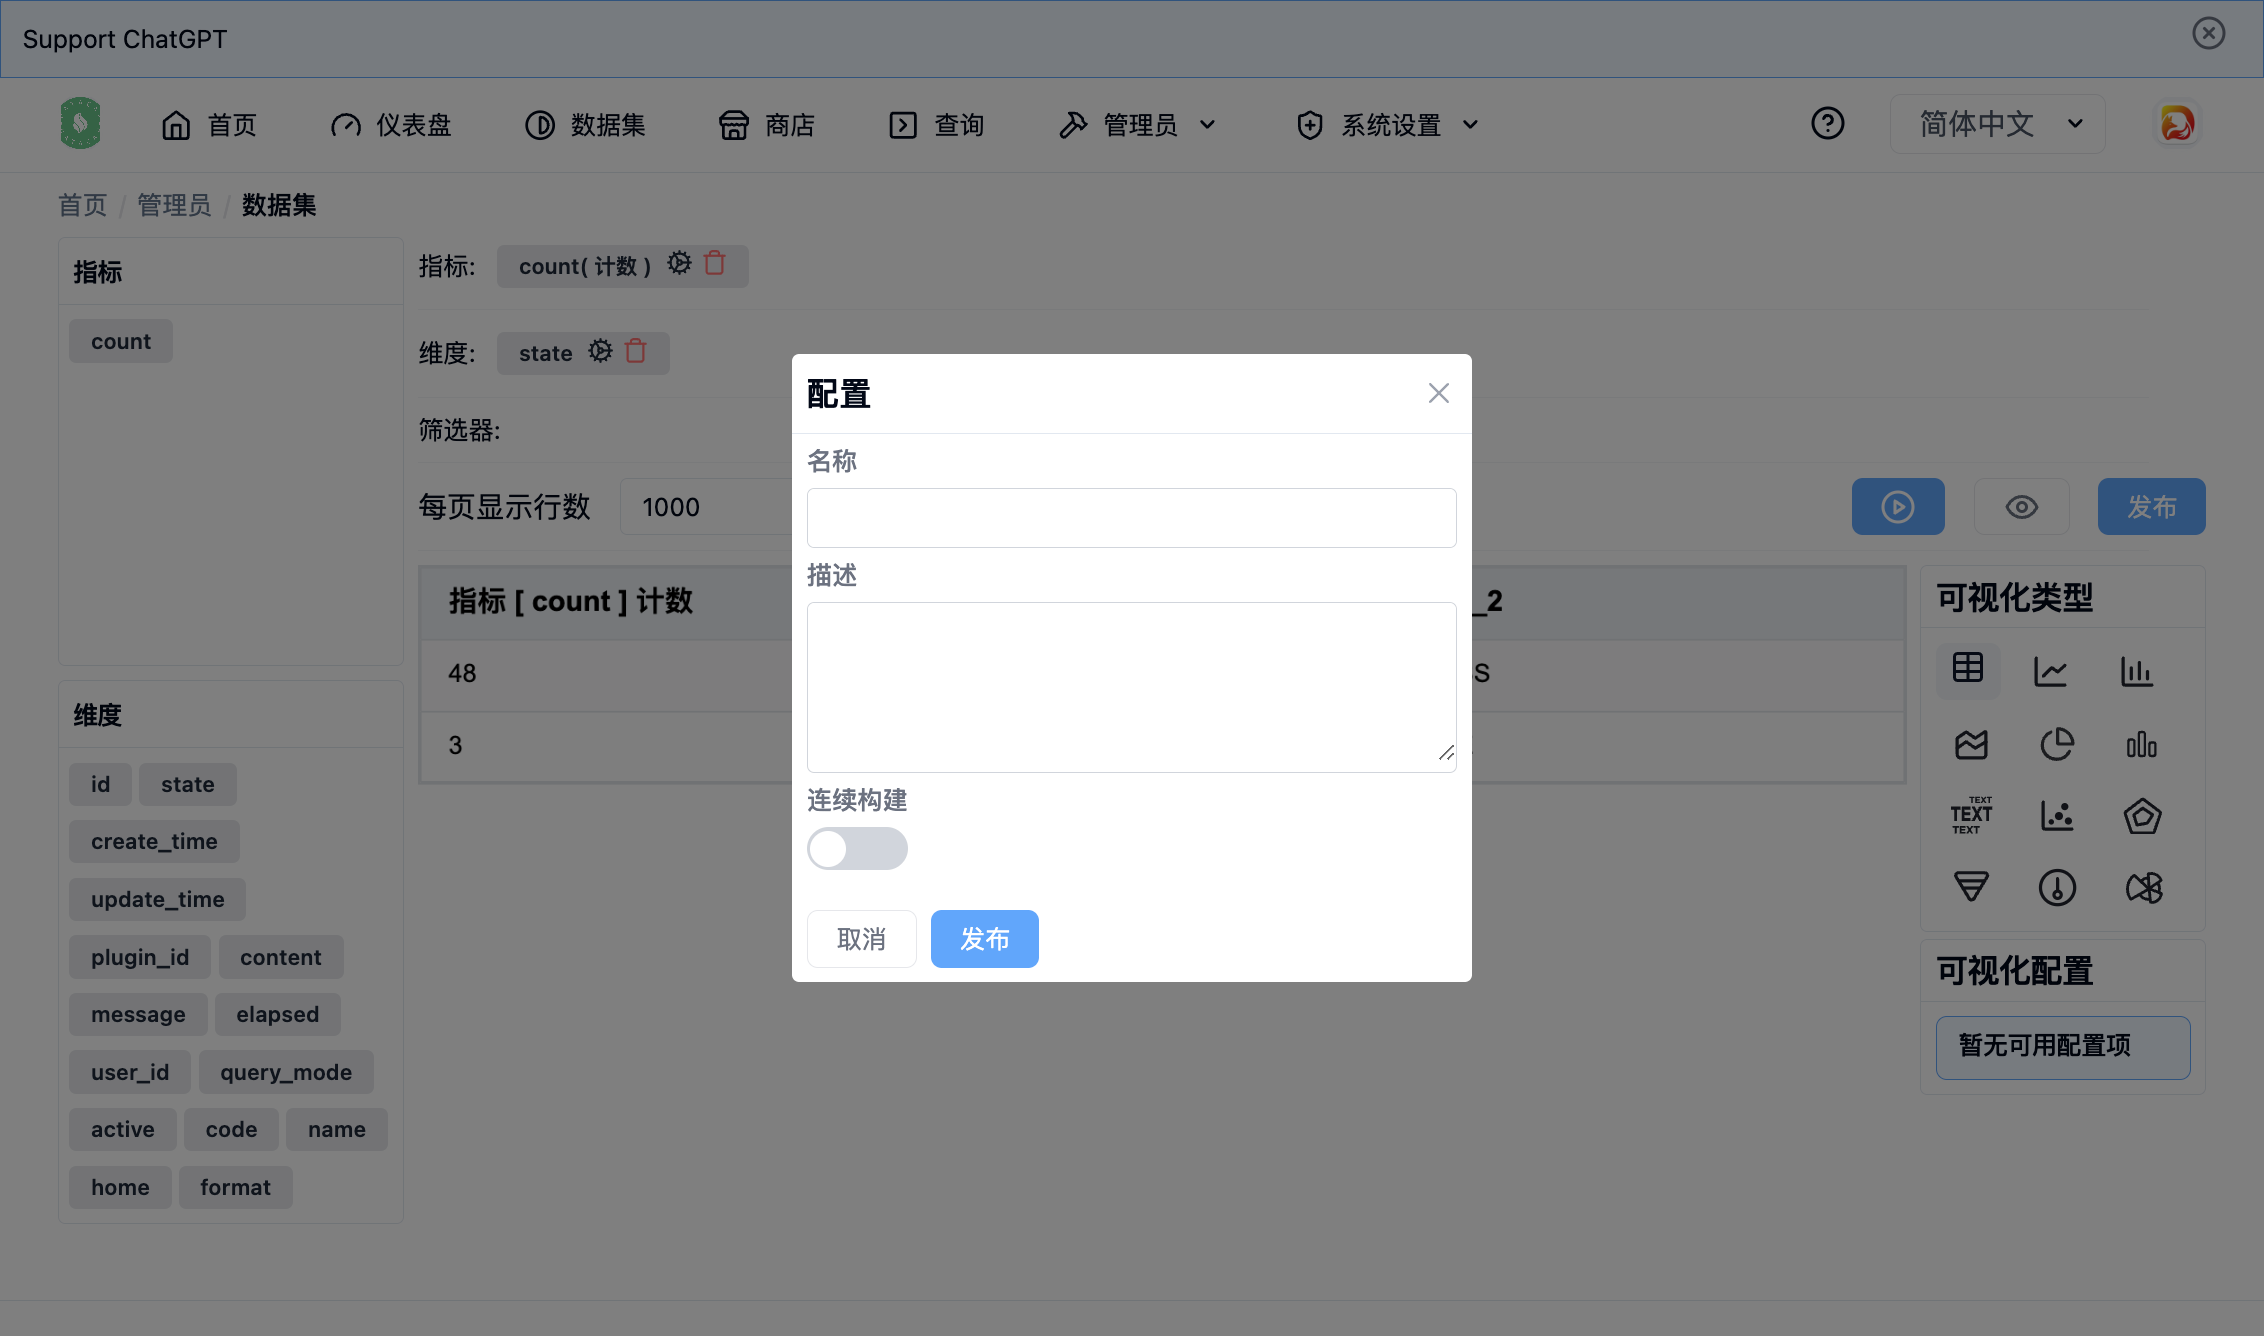 配置图表的名称后点击
操作
按钮,大概如下
即席查询
页面
指标
&
维度
配置,右侧是
查询
配置
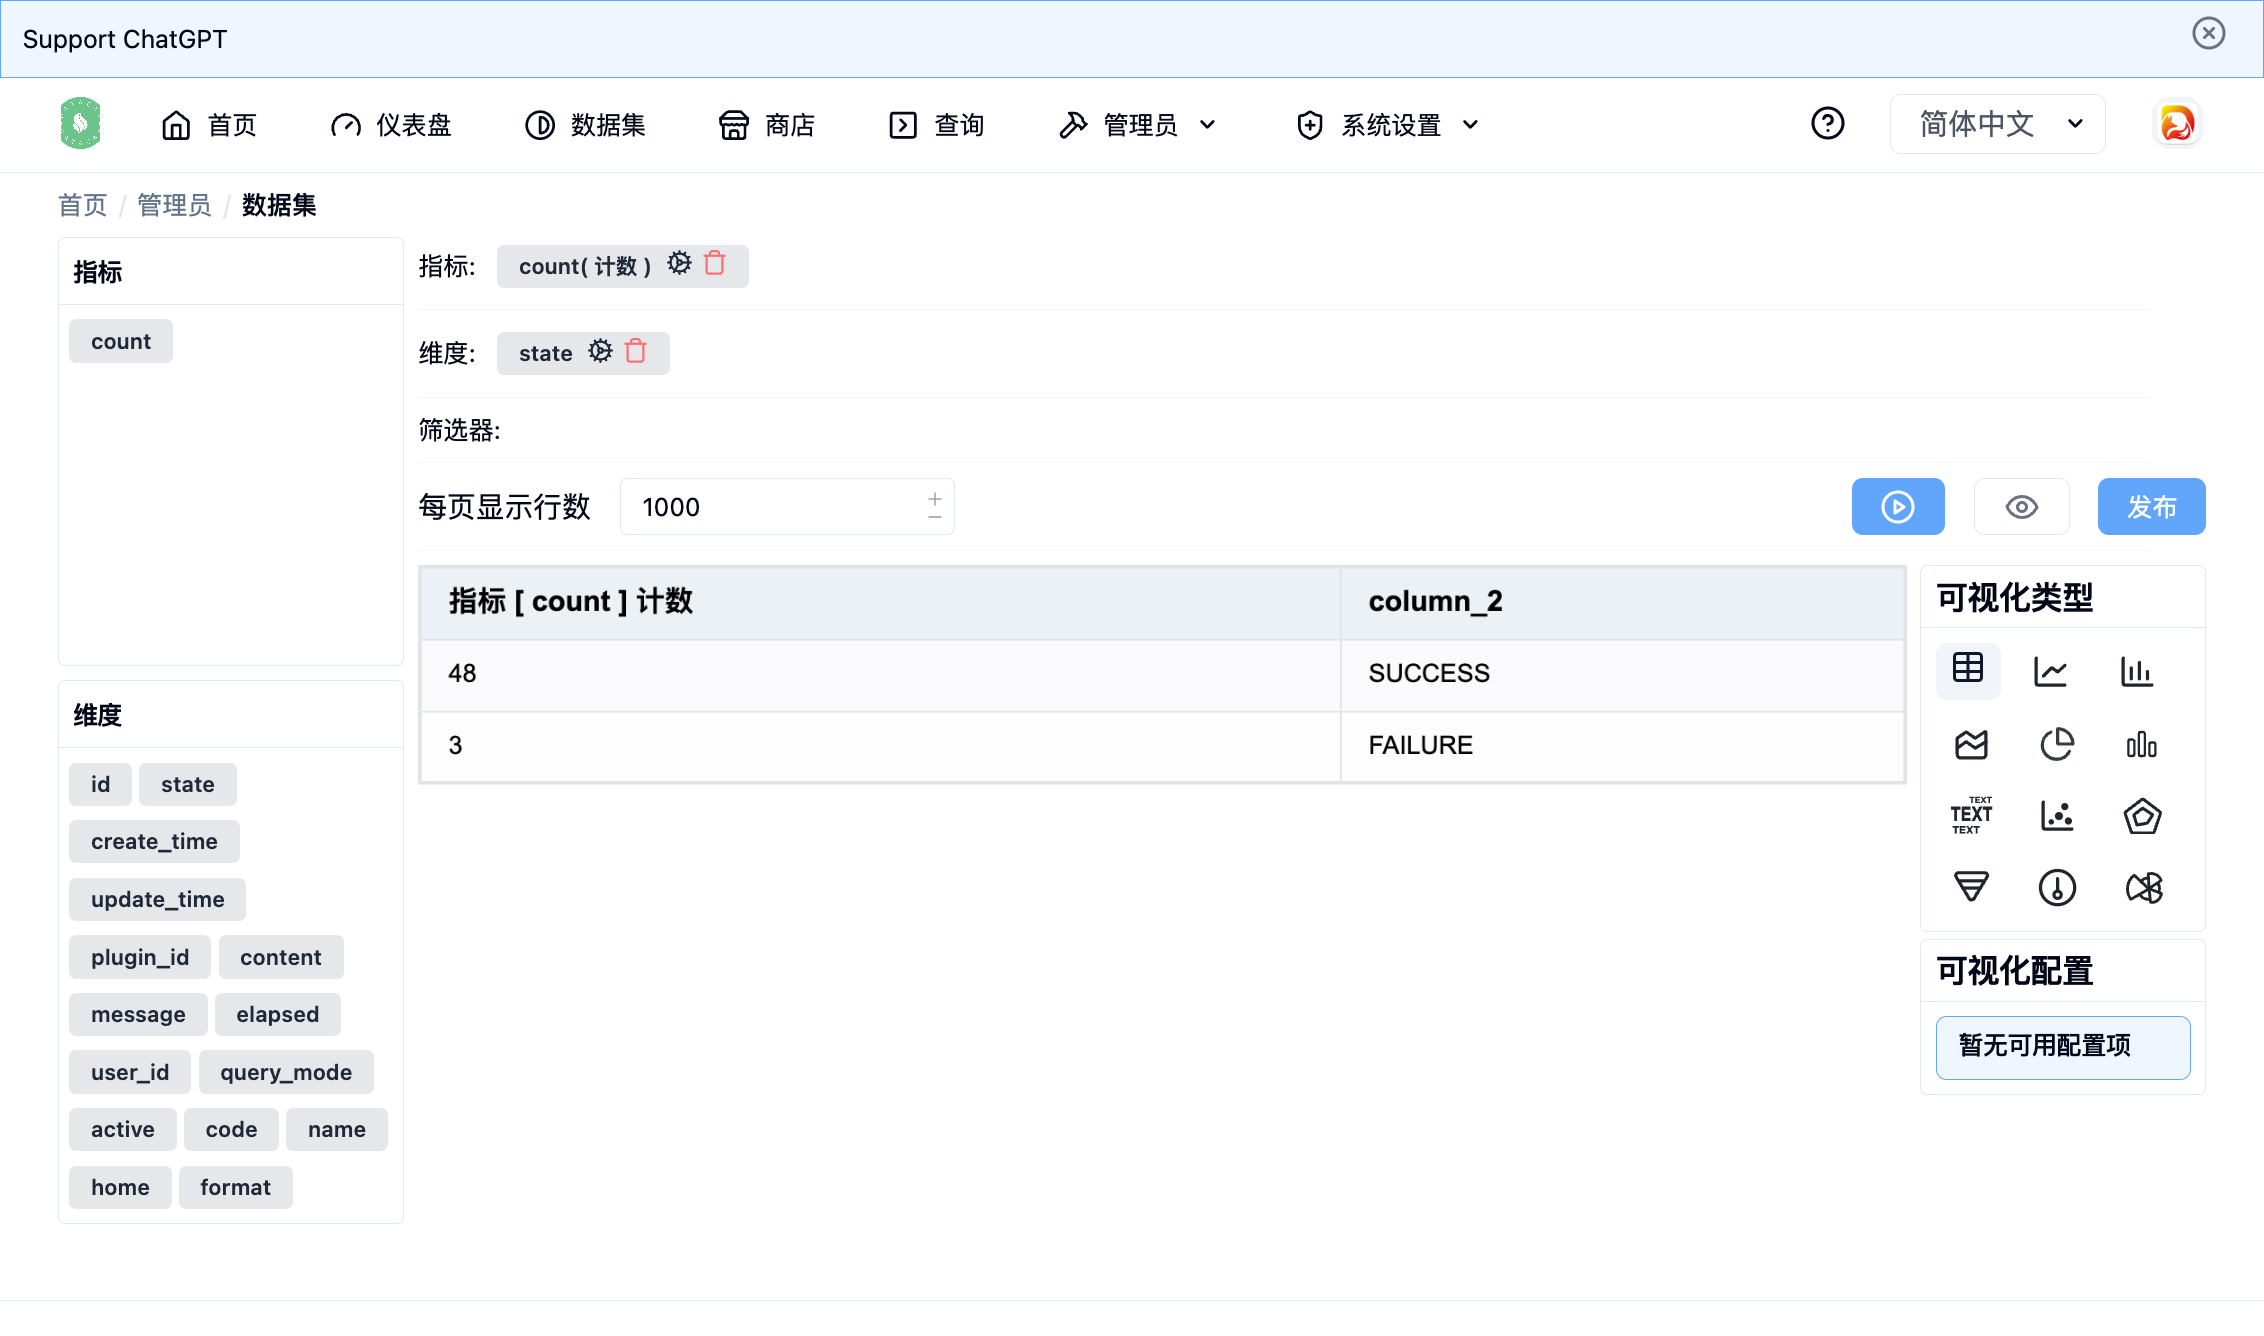
当拖拽左侧的
指标
&
维度
时会在右侧显示查询结果
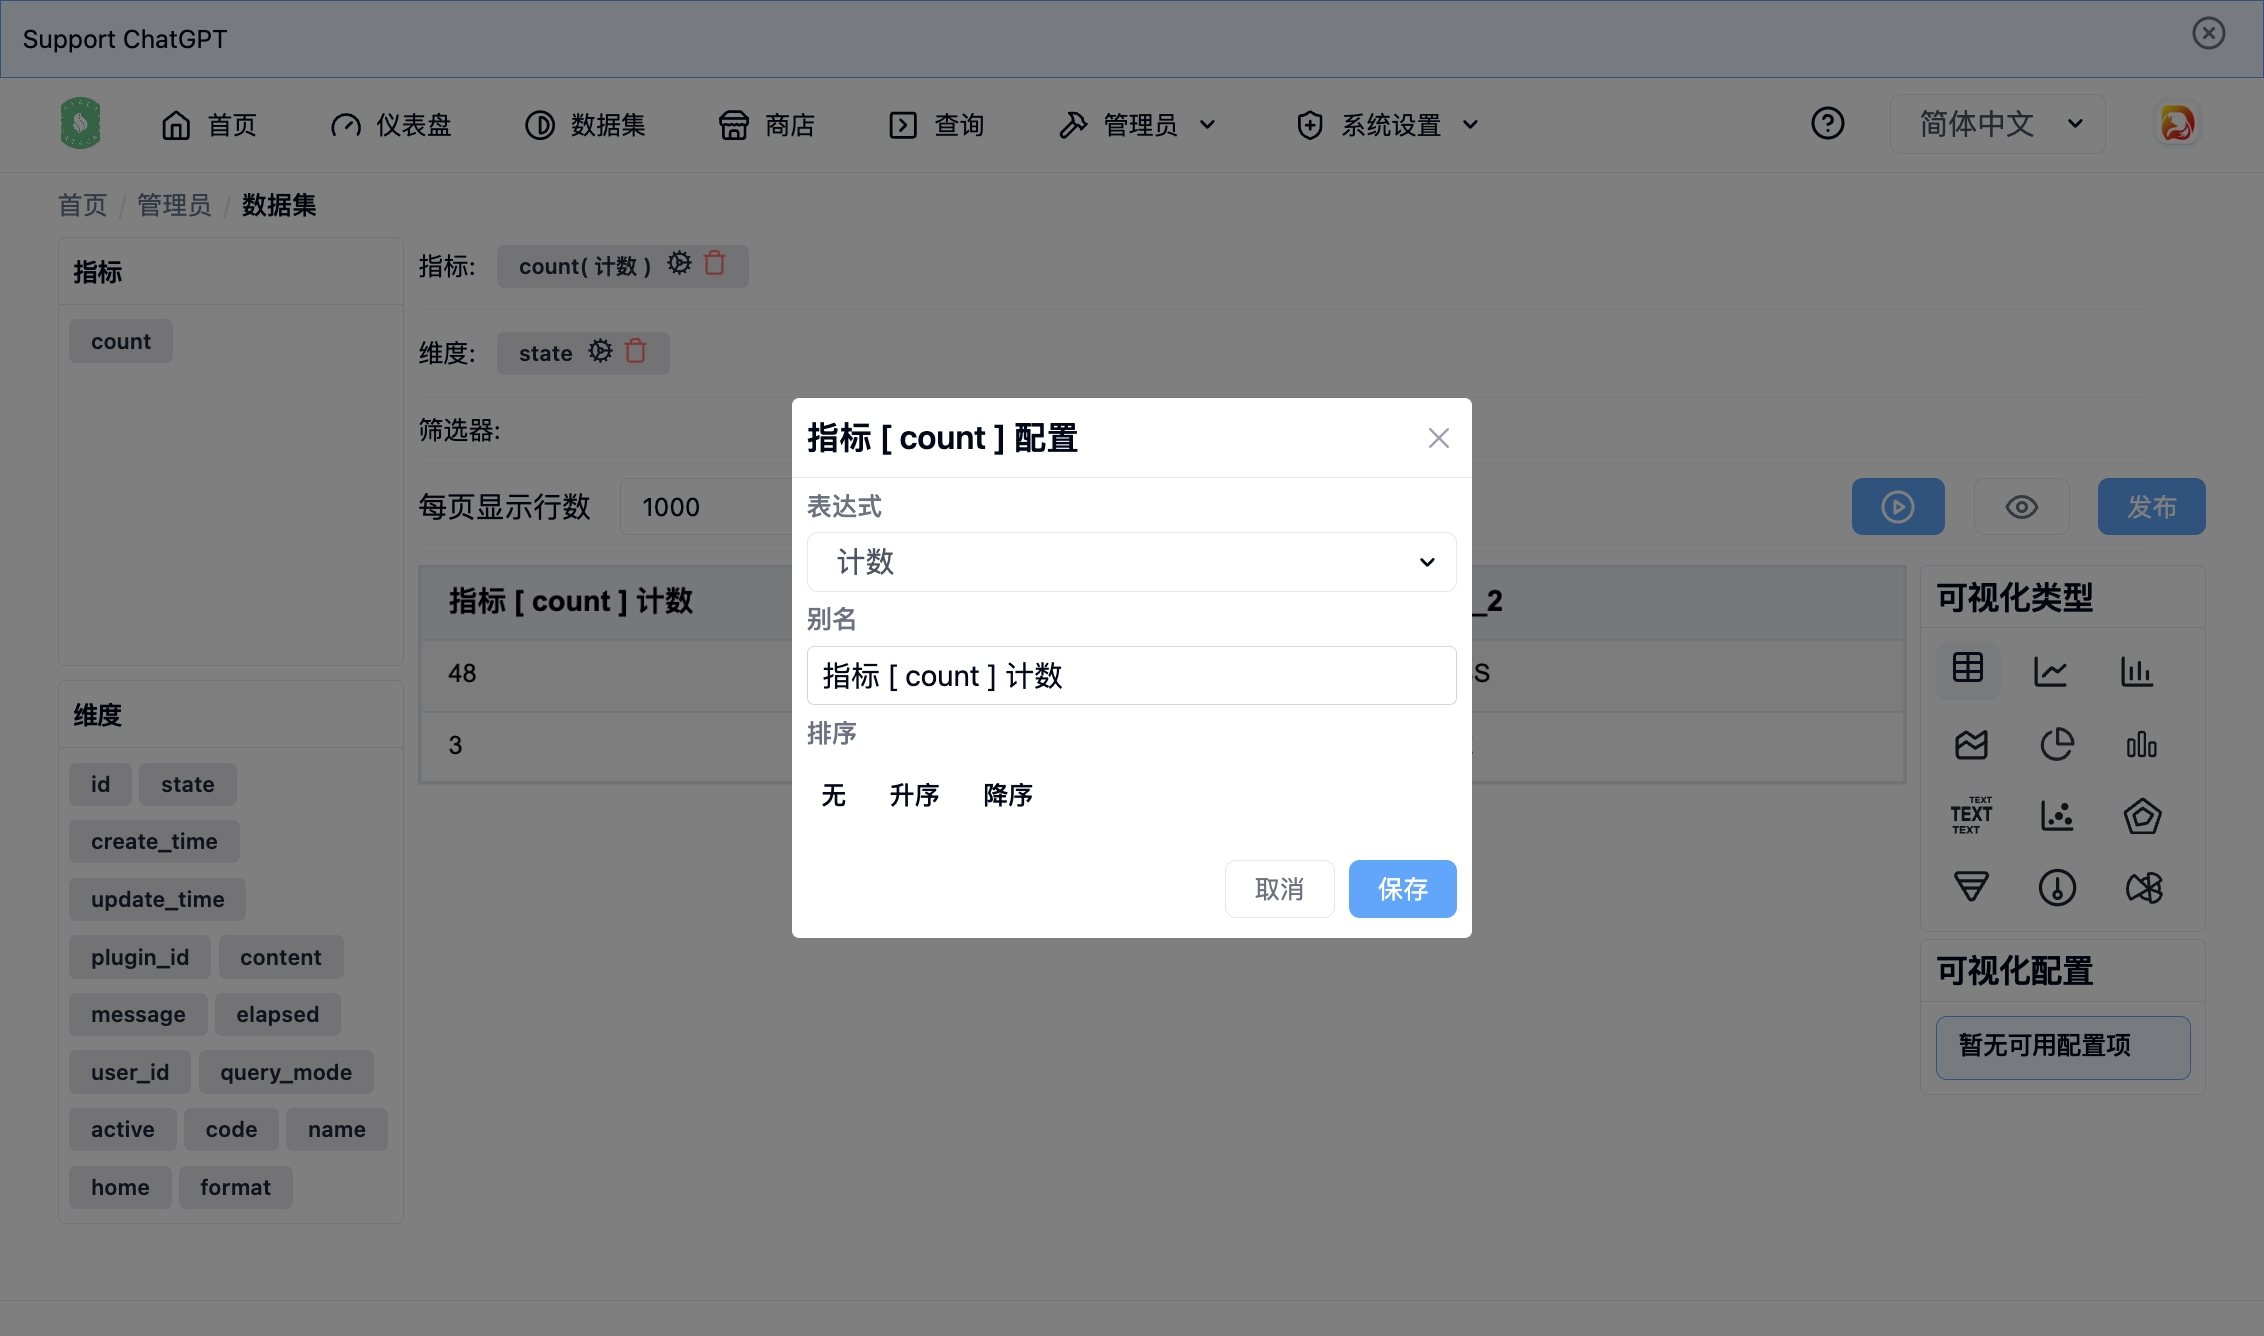
指标配置
当查询列包含指标时,点击指标后面的 ,弹出如下窗口
表达式
,
别名
,
排序
。
注意
不同的类型指标包含不同的表达式
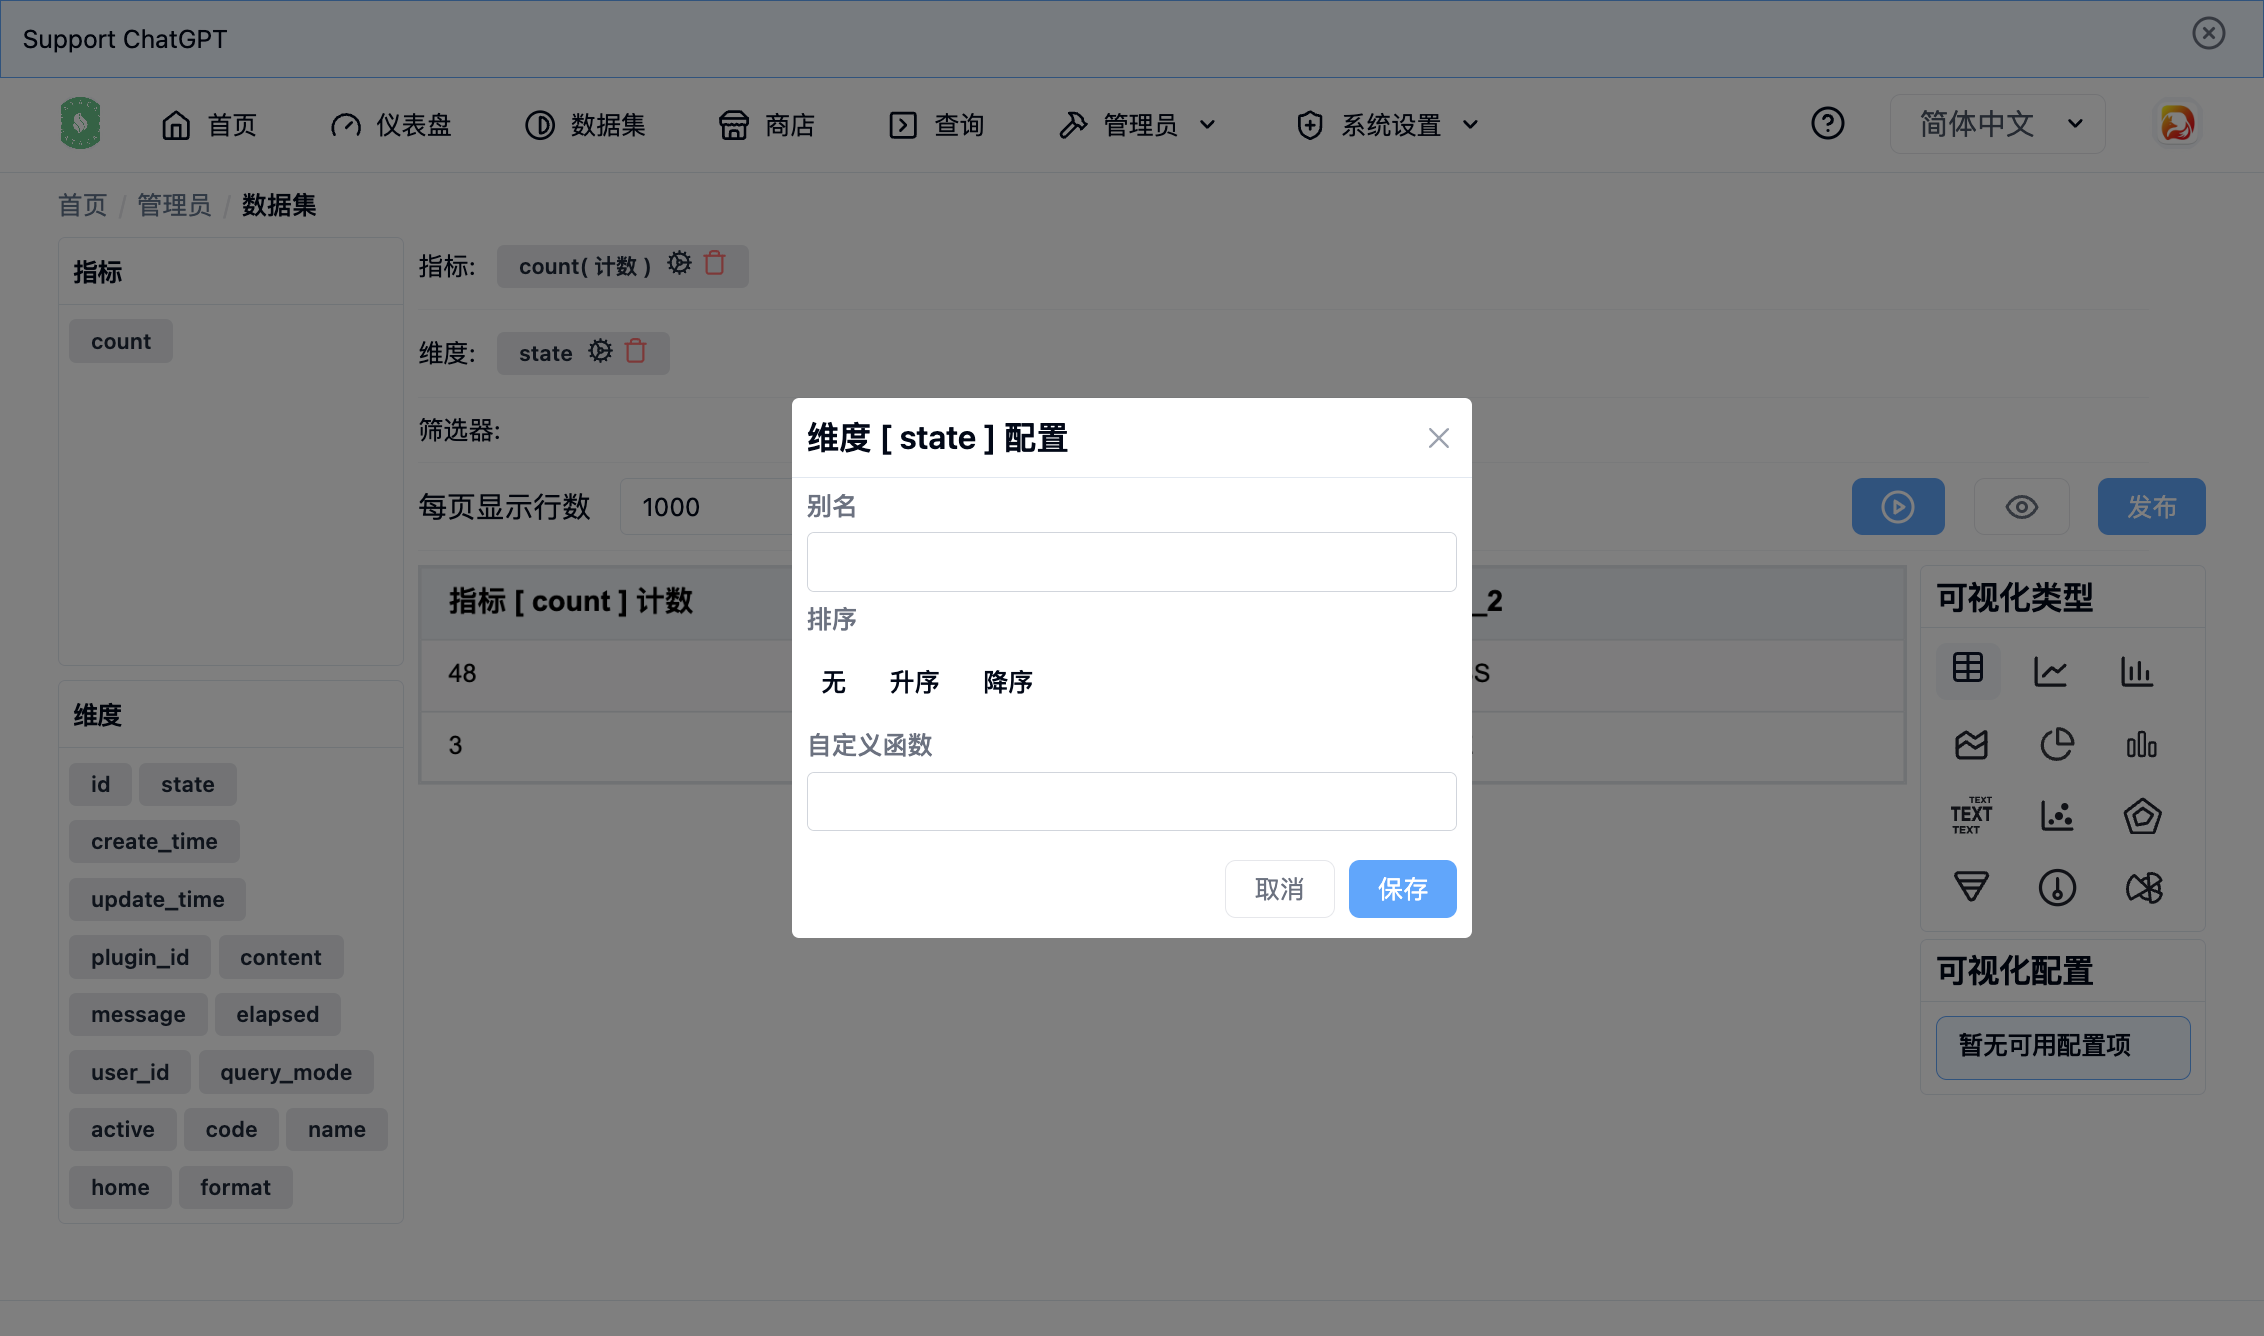
维度配置
当查询列包含维度时,点击 ,弹出如下窗口
别名
,
排序
,
自定义函数
。
图表配置
当查询成功后,可以配置多种图表类型。
发布图表
图表配置完成后,点击发布
按钮,弹出如下窗口
发布
按钮,图表发布成功后,可以在图表列表中查看。
贡献者
